| introduction |
| the laws of attraction |
| analysing the results |
| distribution of quality of life |
|
|
Taken as a whole, the quality of life scores for the Gauteng city-region skew towards the upper end of the scale, with a mean between 6 and 7 out of 10 (where 10 is ‘perfect’), and no respondents scoring below 2 out of 10 – but a fair proportion scoring above 8 out of 10.
|
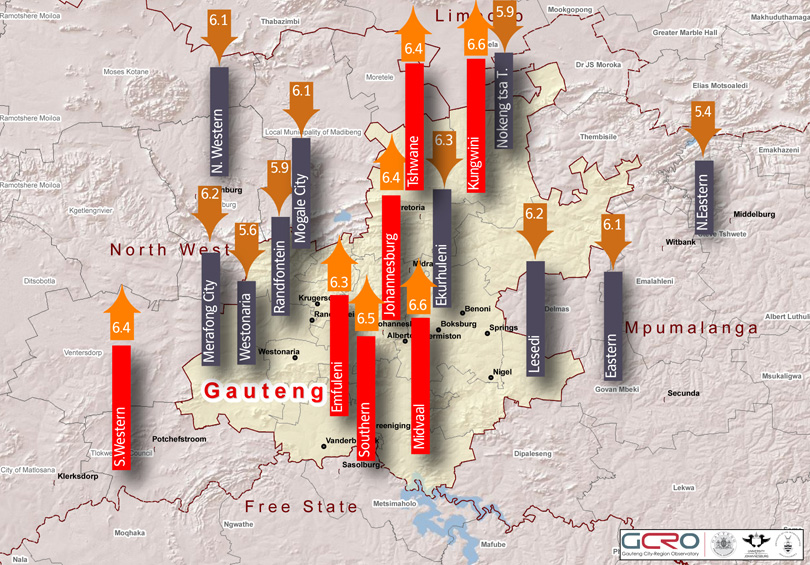
| quality of life: means for all municipalities |
|
The graphic shows those municipalities which had quality of life scores above the GCR-wide mean of 6,32 in red, and those which had scores below the mean in grey. It clearly matters where in the GCR you live: quality of life is unevenly distributed, with wealthier municipalities like Midvaal and the bigger cities of Johannesburg and Tshwane at the upper end of the scale, and smaller municipalities on the fringes of the city-region at the bottom of the scale. This may explain why, between 2001 and 2007, five municipalities on the fringes of Gauteng shrunk, while the three metropolitan centres and smaller municipalities in the centre of the province grew. |