| decent work where? |
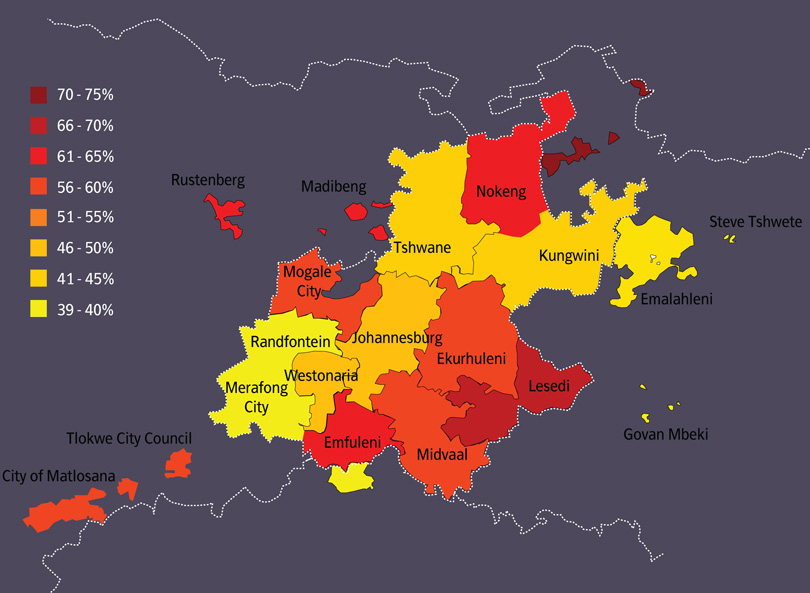
Analysed by race, GCRO’s Decent Work Index shows that African workers remain worse off than other groups. Over half of African respondents (56%) had 0-4 items on the index (low), followed by coloureds (31%), whites (28%) and Indians (26%). By age, 18% of respondents aged 35-65 were in the high category of decent work, followed by those aged 25-34 at 17%. The more vulnerable position of younger workers was highlighted by the fact that only one in ten (10%) of the 17-24 age group were in decent work. Quality of work improves with level of education, according to the survey. Of those employees with no more than a primary education, a mere 2% enjoyed high decent work. By contrast 35% of respondents with tertiary education scored high on the index. Decent work varies considerably across the different parts of Gauteng. The map below indicates that decent work is likely to be higher in some areas than in others. This is primarily due to the composition of employment in different parts of the GCR. Where employment is dominated by the highly-unionised mining industry (as in Westonaria), or by government work (as in Tshwane) the decent work index is likely to be higher.
|
| percentage of workers with low decent work in each municipality |
|
| GCRO (2009) ‘Quality of Life’ survey |