| satisfaction with government | ||
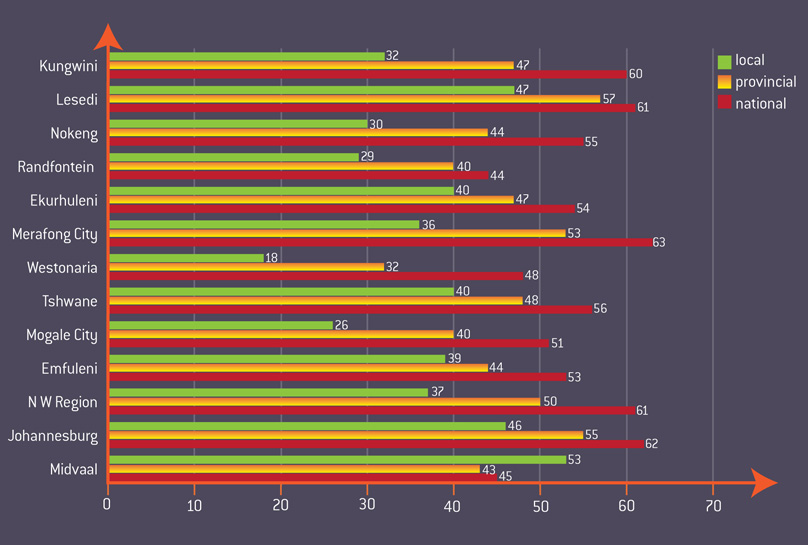
Impressions of government bureaucracy and elected leaders reflect in overall levels of satisfaction with government. The ‘Quality of Life' survey shows a mixed picture, but of particular concern is the much lower levels of satisfaction with local government relative to the other spheres, and especially amongst some population groups. Overall, six out of ten people are ‘satisfied or very satisfied’ with national government, and five in ten are ‘satisfied or very satisfied’ with provincial government. But satisfaction drops to only four in ten for local government. Sixty-one percent of African respondents were ‘satisfied or very satisfied’ with national government, followed by 59% of Indians and 51% of coloureds. White respondents have a much lower opinion of national government, with only 38% being ‘satisfied or very satisfied’. A roughly similar pattern was found when respondents were asked about provincial government, although Indians (at 57% ‘satisfied or very satisfied’) were happier with this sphere than Africans (at 52%) and coloureds (at 50%). Whites were again the least satisfied, at 36% ‘satisfied or very satisfied’. However, the results for municipal government are remarkable: only 41% of Africans were ‘satisfied or very satisfied’ with their municipality, compared to 51% for Indians, 37% for coloureds and 38% for whites. Respondents were also asked what level of government they think has contributed the most to improving their quality of life. Fifty percent of Africans thought that national government had done the most for them, 14% provincial government and 11% local government. Twenty-four percent of Africans thought that no sphere of government had done anything for them. Whites placed much lower value in government generally, with 41% saying than none of the spheres of government had made a contribution to improving their quality of life. Twenty-eight percent of whites thought that national government had made the greatest difference, 14% provincial government and 16% local government. The ‘Quality of Life' survey also suggests big differences in satisfaction between municipal areas, as illustrated in the graphs and maps below. Clearly, while much progress has been made, there remain significant challenges in building the capacity of government to interact effectively across all communities to satisfy the needs of the majority of residents in all areas. |
||
| percentage satisfaction with different spheres of government across municipalities | ||
 |
||
| GCRO (2009) ‘Quality of Life’ survey | ||
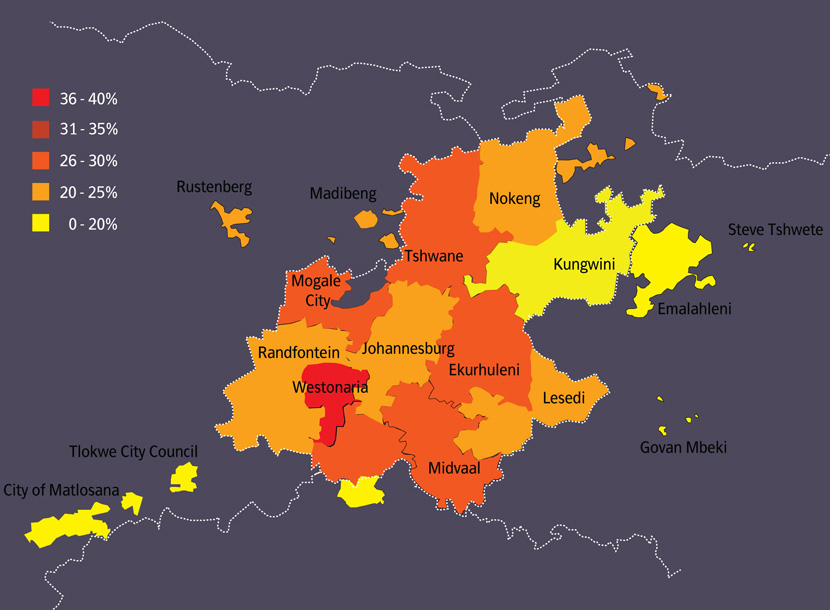
| percentage dissatisfaction with national government across the GCR | ||
 |
||
| GCRO (2009) ‘Quality of Life’ survey | ||