| introduction |
| growth across GCR |
| the allure of Gauteng |
| in-migration |
| considering it home |
| domestic tourism |
| growth across GCR | ||
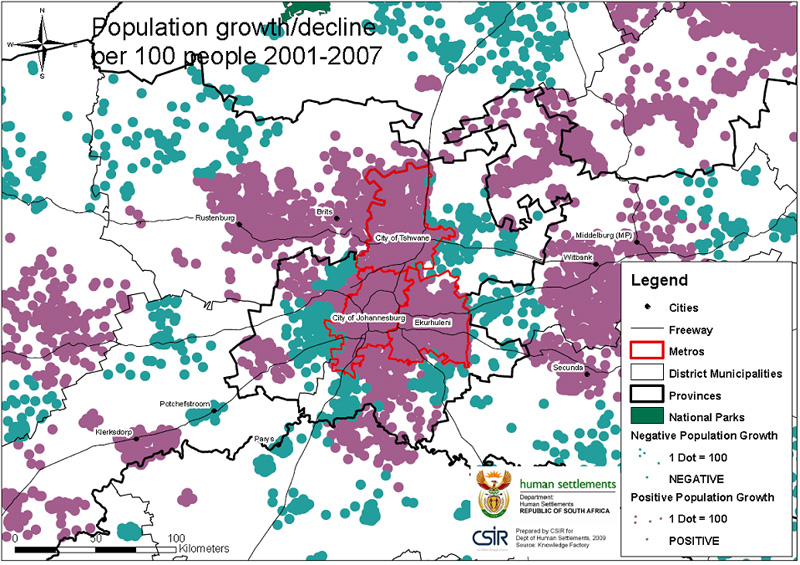
Population growth is not occurring uniformly within the GCR – as illustrated in the map below, the population is shrinking in some places and bulging in others. The green dots represent negative population growth, the pink dots show positive growth, measured between 2001 and 2007. This is evidence of the migration of GCR residents from the poorer, less capacitated municipalities on the borders of Gauteng towards the larger metros of Johannesburg, Tshwane and Ekurhuleni. |
||
population growth and decline across the GCR between 2001 and 2007 |
||
 |
||
National Department of Human Settlements (2009) |
||